


Schedule 6
Peak flow calculation method for drainage basins whose area is equal to or less than 60 km2
The so-called rational method is used to calculate the 10-year interval peak flow. The method was validated for drainage basins whose area is less than 25 km2. Thus, where the area of the drainage basin covers between 25 and 60 km2, the result must be validated in the field by looking for signs indicating the water level reached by the floods of previous years or by establishing a relationship with basins that were measured on the same territory or near it.![]()
1
Additional information
Validation of peak flow calculation when the result of this calculation imposes the installation of a conduit with a diameter much larger than the average width of the watercourse.
The methods for calculating peak flows in Schedules 6 and 7 are based on several assumptions, which may make them less suitable for some drainage basins. Sometimes significant differences can be observed between calculated peak flows and flows recorded in the field.
Where the results of flow calculations require the installation of conduits with diameters far greater than the average width of the watercourse observed in the field, it is possible, based on evidence indicating the water level reached by flooding in previous years or by establishing a relationship with basins measured on or near the same territory, to notify the management unit in charge ![]() (in French) prior to the installation of a conduit with a diameter less than that determined by the calculation. Supporting documentation submitted by the professional in charge must be submitted (including, but not limited to, calculation of peak flow, average watercourse width, free flow of fish to be insured or not, result of field surveys reflecting choice, identification of inconsistency in flow calculation, etc.).
(in French) prior to the installation of a conduit with a diameter less than that determined by the calculation. Supporting documentation submitted by the professional in charge must be submitted (including, but not limited to, calculation of peak flow, average watercourse width, free flow of fish to be insured or not, result of field surveys reflecting choice, identification of inconsistency in flow calculation, etc.).
In this situation, the diameter of the conduit should be consistent with the average width of the watercourse to be crossed. Under no circumstances should the conduit reduce the width of the watercourse by more than 20%, measured at the upper bank limit. The height of water in the conduit must be less than or equal to 85% of the clearance height after it is buried.
Steps in calculation
- Delimitation of the drainage basin;
- Calculation of the average slope of the drainage basin;
- Identification of the use of the territory and of the surface deposits in the drainage basin;
- Calculation of the total area of the basin, of the proportion of each type of surface deposits per land use type and of the percentage of the basin covered by lakes and bare and semi-bare wetlands;
- Determination of the watercourse’s length and calculation of the “85-10” slope of the watercourse;
- Calculation of the weighted runoff coefficient of the drainage basin;
- Calculation of the drainage basin’s concentration time;
- Determination of rainfall intensity;
- Calculation of the correction coefficient for rainfall intensity;
- Determination of the reduction coefficient for peak flow;
- Calculation of the 10-year interval peak flow.
Explanation of the steps to be followed with an example
Step 1 – Delimitation of the drainage basin
The drainage basin that supplies the watercourse with water at the crossing point is delimited using a topographic map at a scale of
1: 20 000. Figure 1 shows, as an example, the delimitation of a drainage basin under study.

Step 2 – Calculation of the average slope of the drainage basin (Sb)
The average slope is calculated using a grid (1 cm X 1 cm) superimposed on the drainage basin. The number of times each horizontal and vertical line of that grid crosses a contour line must be determined. The length of those lines is also recorded. The calculation made to determine the average slope of the drainage basin under study is given in figure 2.
")
Step 3 – Identification of the use of the territory and of the surface deposits in the drainage basin
With the help of the surface deposit maps, the forest maps and knowledge of the territory, the use of the lands comprised within the drainage basin must be identified. They may be woodlands, pasturelands or croplands. Then the surface deposits for each land use type must be identified. Bare and semi-bare wetlands must also be located.
Figure 3 identifies the surface deposits and locates the bare and semi-bare wetlands in the drainage basin under study, which is completely wooded.

Step 4 – Calculation of the total area of the basin, of the proportion of each type of surface deposits per land use type and of the percentage of the basin covered by lakes and bare and semi-bare wetlands
In the case of the basin under study, according to figure 3, the results are the following:

1 Identification of surface deposits and location of lakes and bare and semi-bare wetlands
Step 5 – Determination of the watercourse’s length (Lc) and calculation of the “85-10” slope of the watercourse (Sc)
The length of the watercourse is measured from the crossing point, following the course of the main watercourse extended to the watershed divide, that is, to the most distant point in the drainage basin determining the longest route a drop of water must travel to reach the crossing point.
The “85-10” slope of the watercourse is defined as the average slope of the section of the watercourse between 2 points located respectively 10% upstream from the crossing point and 15% downstream from the farthest limit of the drainage basin.
Figure 4 locates the line determining the length of the watercourse (Lc) and figure 5 shows the calculation method for the “85-10” slope of the watercourse (Sc) for the drainage basin under study.

")
Step 6 – Calculation of the weighted runoff coefficient of the drainage basin (Cp)
Firstly, using table 1, the various types of surface deposits in the drainage basin are classified on a hydrological basis.
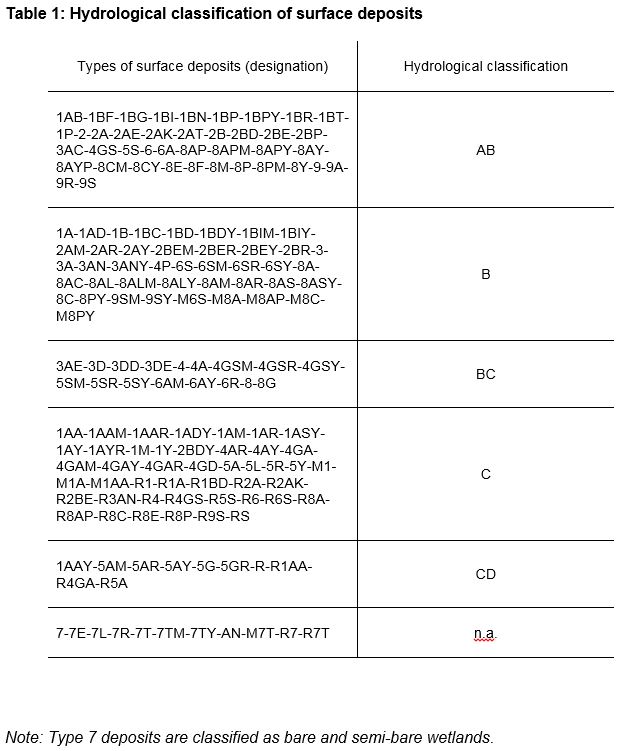
Note: Type 7 deposits are classified as bare and semi-bare wetlands.
When the hydrological classification of surface deposits is completed, the runoff coefficient for each type of deposit is determined using table 2 based on land use and the average slope of the drainage basin.
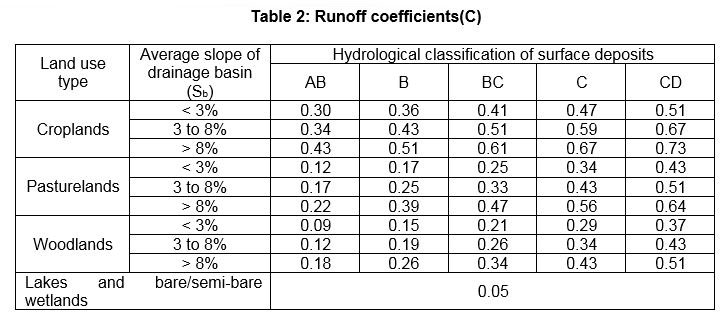
Then the weighted runoff coefficient for the drainage basin may be calculated (Cp). In the case of the basin under study, the data and calculations are the following:
Weighted runoff coefficient
(Cp) = (57% X 0,26)+(31% X 0,26)+(5% X 0,18)+(7% X 0,05)=0,24
Step 7- Calculation of the drainage basin’s concentration time (tc)
The concentration time of the drainage basin is determined using one of the following 2 formulas:
If Cp < 0,40
tc = (3,26 (1,1 – Cp) Lc0,5)/Sc0,33
where :
tc : concentration time (minutes)
Cp : weighted runoff coefficient for the basin
Lc : length of watercourse (m)
Sc : “85-10” slope of the watercourse (%)
if Cp ≤ 0,20, Sc minimum to be used = 0,1%
if 0,20 < Cp < 0,40, Sc minimum to be used = 0,5%
tc minimum = 10 minutes
If Cp ≥ 0,40
tc = (0,057 Lc)/(Sc 0,2 Ab 0,1)
where:
tc : concentration time (minutes)
Lc : length of watercourse (m)
Sc : “85-10” slope of watercourse (%)
Ab : area of drainage basin (ha)
tc minimum = 10 minutes
In the case of the basin under study, the Cp is equal to 0.24. Consequently, the first formula must be used.
tc = (3,26 (1,1 – 0,24) x 3 600 0,5)/1,9 0,33= 136 minutes
Step 8 – Determination of rainfall intensity (I)
Rainfall intensity is determined using figures 6 and 7.
In figure 6, average total rainfall of a 1-hour duration for the basin under study is indicated by the contour line closest to that basin.
 of a 1-hour duration")
Figure 7 indicates the standard deviation for the total rainfall of a 1-hour duration.
 of a 1-hour duration")
The rainfall intensity applicable to the drainage basin is determined as follows:
I = average total rainfall of a 1-hour duration + (1.305 X standard deviation for total rainfall of a 1-hour duration).
In our example, which is located on sheet 21M/6 N.E., the average is 22 mm/hour and the standard deviation is 8 mm/hour. The rainfall intensity applicable to that drainage basin is therefore 32.4 mm/hour, that is, 22 + (1.305 X 8).
Step 9 – Calculation of the correction coefficient for rainfall intensity (Fi)
Depending on the concentration time of the drainage basin, the correction coefficient for rainfall intensity is calculated using one of the following 2 formulas:
Fi = 12,25/tc0,612 for 10 minutes ≤ tc < 60 minutes
Fi = 17,07/tc0,693 for tc ≥ 60 minutes
where:
tc: temps de concentration (minute)
In the case of the basin under study, the second formula must be used (tc = 136 minutes).
Fi = 17,07/136 0,693= 0,567
Step 10 – Determination of the reduction coefficient for the peak flow (FL)
The retention zones such as lakes and bare and semi-bare wetlands entail a significant reduction in the peak flow. The reduction coefficient for peak flow is evaluated using the proportion of lakes and bare and semi-bare wetlands calculated at step 4 and figure 8. In the case of the basin under study, that coefficient is 0.69 (curve B, 7% covered by lakes and bare and semi-bare wetlands).

Step 11 – Calculation of the 10-year interval peak flow (Q10)
That flow is calculated using the following formula:
Q10 (m³/s) = (Cp Fi I Ab FL)/360
where:
Cp = Weighted runoff coefficient for the drainage basin
Fi = Correction coefficient for rainfall intensity
I = Rainfall intensity (mm/hour)
Ab = Area of the drainage basin (ha)
FL = Reduction coefficient for peak flow
For the basin under study:
Q10 = (0,24 X 0,567 X 32,4 X 414 X 0,69)/360
Q10 = 3,5 m³/s
A weighted factor of at least 5% is then applied to the flow obtained in order to take into account exceptional climatic events.
Ex : 3,5 m³/s X 1,05 = 3,67 m³/s